
From the author of P3 (Plugin Performance Profiler) — Scrutoscope is the spiritual successor, rebuilt from scratch for modern WordPress.
Your site is slow. Scrutoscope tells you why. It profiles every hook callback during a page request and attributes the time to its source — plugin, theme, core, mu-plugin, or drop-in. You see which plugin costs the most, which queries are heavy, and which HTTP calls block the response.
Everything is included. No premium tier, no feature gates, no upsells. 100% open source.
Live Demo
See a real report from a WooCommerce cart page with 12 active plugins — 544 ms of server time, broken down to the callback. The report is encrypted and decrypted entirely in your browser. The relay server never sees the contents.
What It Measures
- Server Request Duration — Total wall-clock time for the PHP request
- Source Attribution — Every hook callback traced to its plugin/theme/core with exclusive and inclusive timing
- Database Queries — Query text (sanitized), execution time, caller, and source
- HTTP Calls — External request destination host (paths and query strings are stripped), duration, response code, and whether PHP waited for the response (blocking vs. async)
- Autoloaded Options — Option names, sizes, and sources contributing to autoload bloat
- Enqueued Assets — Scripts and stylesheets with sizes and dependency chains
- Hook Execution Trace — Full callback tree by WordPress lifecycle phase
- Timeline — Redesigned request timeline: a cost-sorted ownership bar names the culprit, over a chronological view with phase markers, HTTP and query-density lanes, and a memory curve
Key Features
- Background capture with configurable sample rate (0.1%–100%)
- Route-based grouping with human-readable labels and status code breakdown
- Pin & annotate profiles with notes and tags
- Automatic retention — TTL + per-route cap, pinned profiles exempt
- Cron inventory — all registered WordPress cron events at a glance
- REST API — eight read-only endpoints for AI agent integration
- Send to Agent — one-click prompt with short-lived credentials
- Send to Support — zero-knowledge encrypted sharing
- WP-CLI —
wp scrutoscope status|list|show|delete|export|clear|rebuild-stats|mu-plugin
Design Philosophy
- Read-only by design — Scrutoscope does not change your content, themes, plugins, or site behavior. It stores its own profiling tables, settings, and scheduled cleanup events (plus a record per report you choose to share). Optional early-boot timing adds a small must-use plugin only when you enable it.
- Data first — The dashboard leads with profiling data, not settings.
- Off until asked — Background measurement, query profiling, and early-boot timing are all opt-in. A fresh install just adds its tables and a cleanup task.
- WordPress native — Standard admin patterns.
- Privacy by design — No telemetry. SQL is reduced to verb + table; outbound HTTP URLs are reduced to scheme + host. Sharing is opt-in and end-to-end encrypted.
External Services
Scrutoscope is local-first and does not phone home. It contacts exactly one external service, and only when you explicitly choose to share a report.
Service: Scrutoscope relay — zero-knowledge report sharing.
Provided by: The Scrutoscope Project (https://scrutoscope.dev). Relay source: https://github.com/scrutineerhq/scrutoscope-relay
When it is contacted (admin-initiated only):
- When you click Send to Support / Encrypt & Share to create a shared report.
- When you revoke a report you previously shared.
- When you open a relay-hosted shared report link in your browser.
It is never contacted during normal profiling, page loads, or background capture.
What is sent:
- The encrypted report ciphertext and its initialization vector (IV).
- The time-to-live (TTL) you choose and an optional burn-after-reading flag.
- Key-derivation metadata if you set a passphrase — never the passphrase itself.
- A revoke token, so you can delete the report later.
- Normal HTTP request metadata (IP address, user agent) visible to any web service.
What is never sent:
- The decryption key — it stays in the URL fragment (after
#), which browsers never transmit to the server. - Your passphrase.
- Any plaintext profile data.
Data retention: a shared report expires after the TTL you choose, can be set to burn after its first read, and can be revoked manually at any time. The relay only ever stores ciphertext.
Complementary Tools
Debugging is rarely done with one tool. These free plugins pair well with Scrutoscope and are all private by default with no telemetry:
- Query Monitor — The developer tools panel for WordPress. Shows database queries, hooks, HTTP requests, and more for the current request. Free, by John Blackbourn. Scrutoscope is longitudinal; Query Monitor is point-in-time — they complement each other. Query Monitor now links to Scrutoscope in its Related Tools.
- WP Crontrol — View and manage cron events, their schedules and callbacks. Same author as Query Monitor. Useful when Scrutoscope flags a slow cron hook.
- User Switching — Instantly switch between user accounts to test as different roles. Same author as Query Monitor.
- Laps — Lightweight profiler that adds a toolbar summary of PHP, plugins, theme, and query time. MIT, no wp.org listing — install via Composer or GitHub release. Quick glance vs Scrutoscope’s sampled history.
- Debug This — Admin-bar dump of query vars, rewrite rules, enqueued assets, globals, and more. Fast way to see what’s loaded on the current page.
- Rewrite Rules Inspector — View all rewrite rules and test which rule matches a URL. By Automattic, helpful for debugging permalinks.
- DecaLog — Structured logging and observability for WordPress. Captures events, metrics, and traces with privacy controls. Part of PerfOps One, free and open source.
- Snitch — Network monitor that logs outbound HTTP requests by target URL and source file. Helps spot tracking or unexpected calls. Free, no ads.
- Log HTTP Requests — Simple logger for all WP HTTP requests with runtime. Useful for auditing what data leaves your site.
- Variable Inspector — Inspect PHP variables on a central dashboard in wp-admin via
do_action('inspect', [...]). Handy when Xdebug is overkill.
Other tools often used alongside these (not WordPress plugins, all free and self-hosted): Xdebug, XHProf, Clockwork, and the WP-CLI profile command.
Screenshots
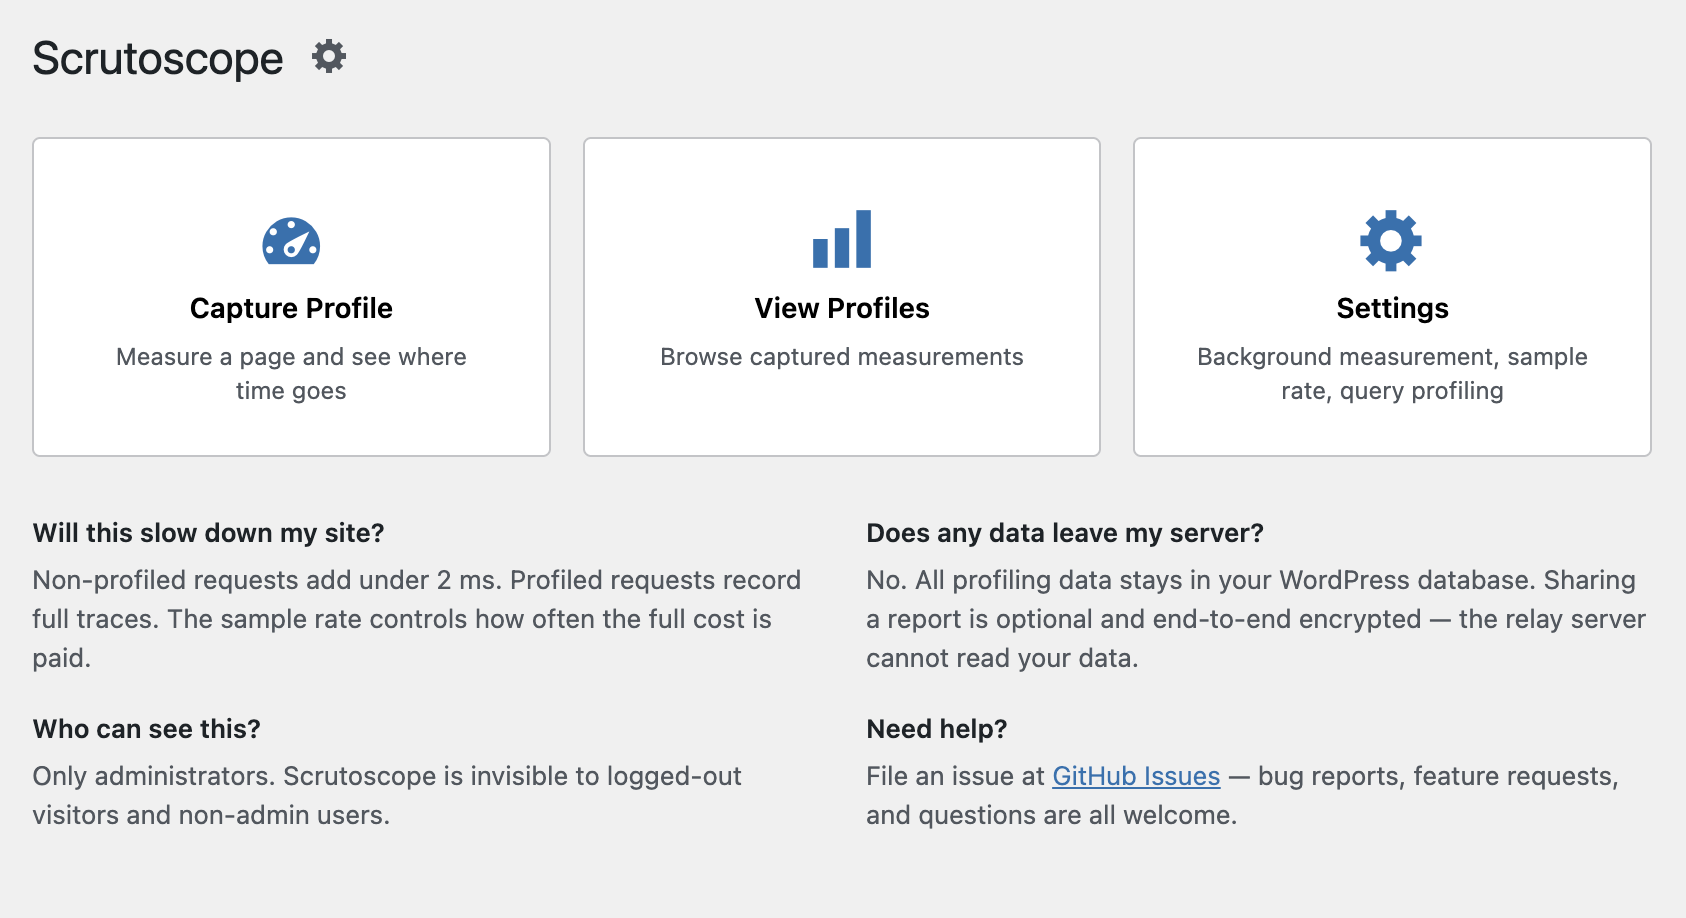
Dashboard home with quick-start cards and FAQ
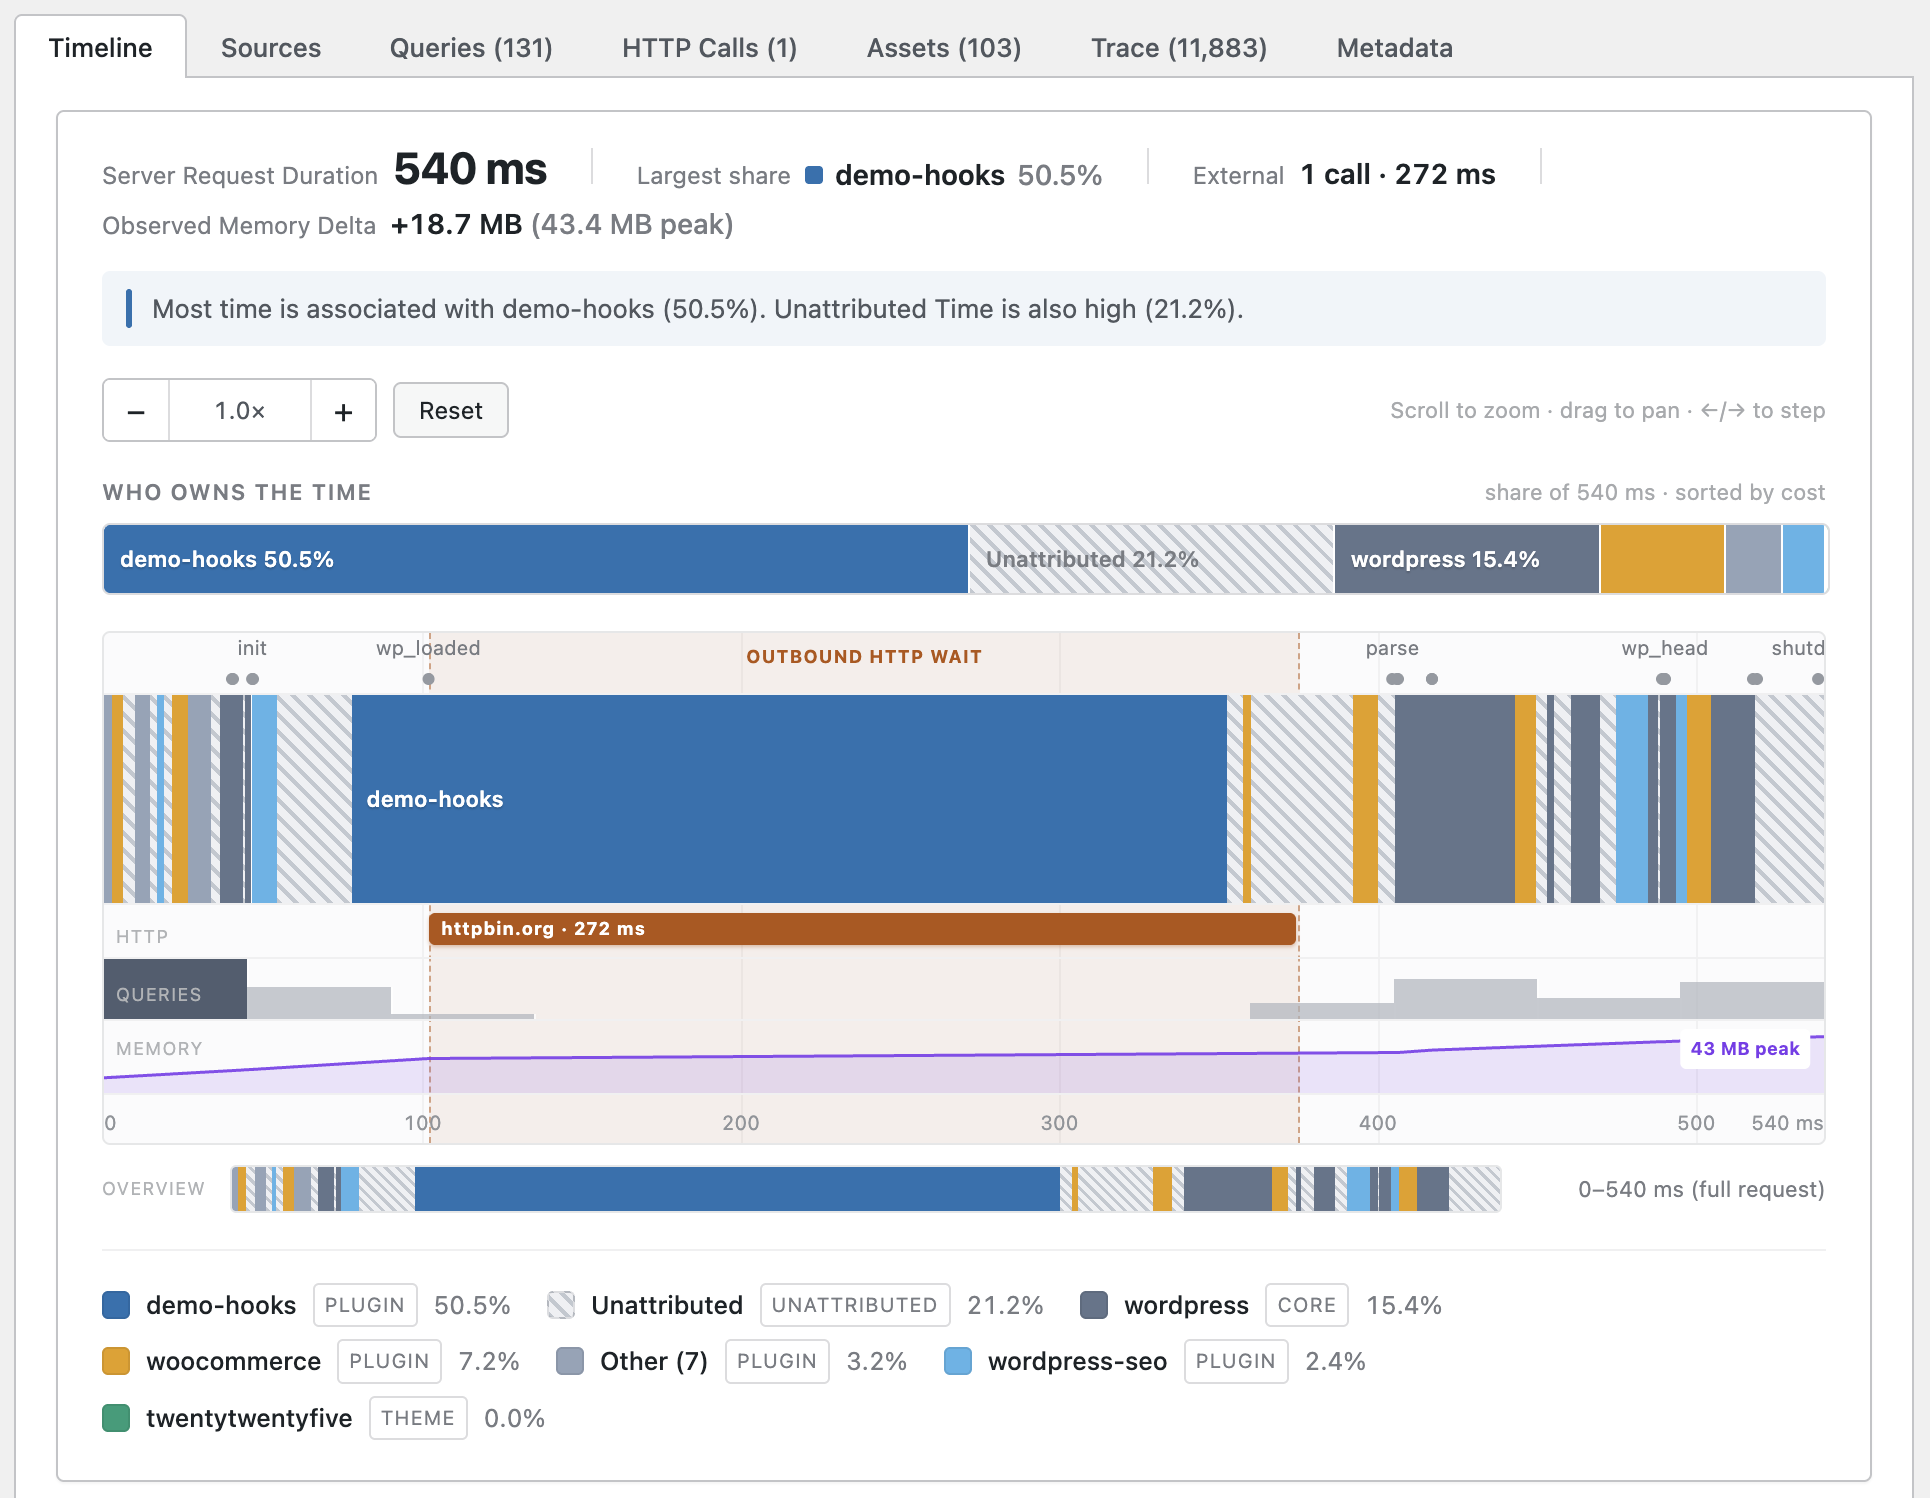
Request Timeline showing phase markers, HTTP wait lane, query density, and memory curve
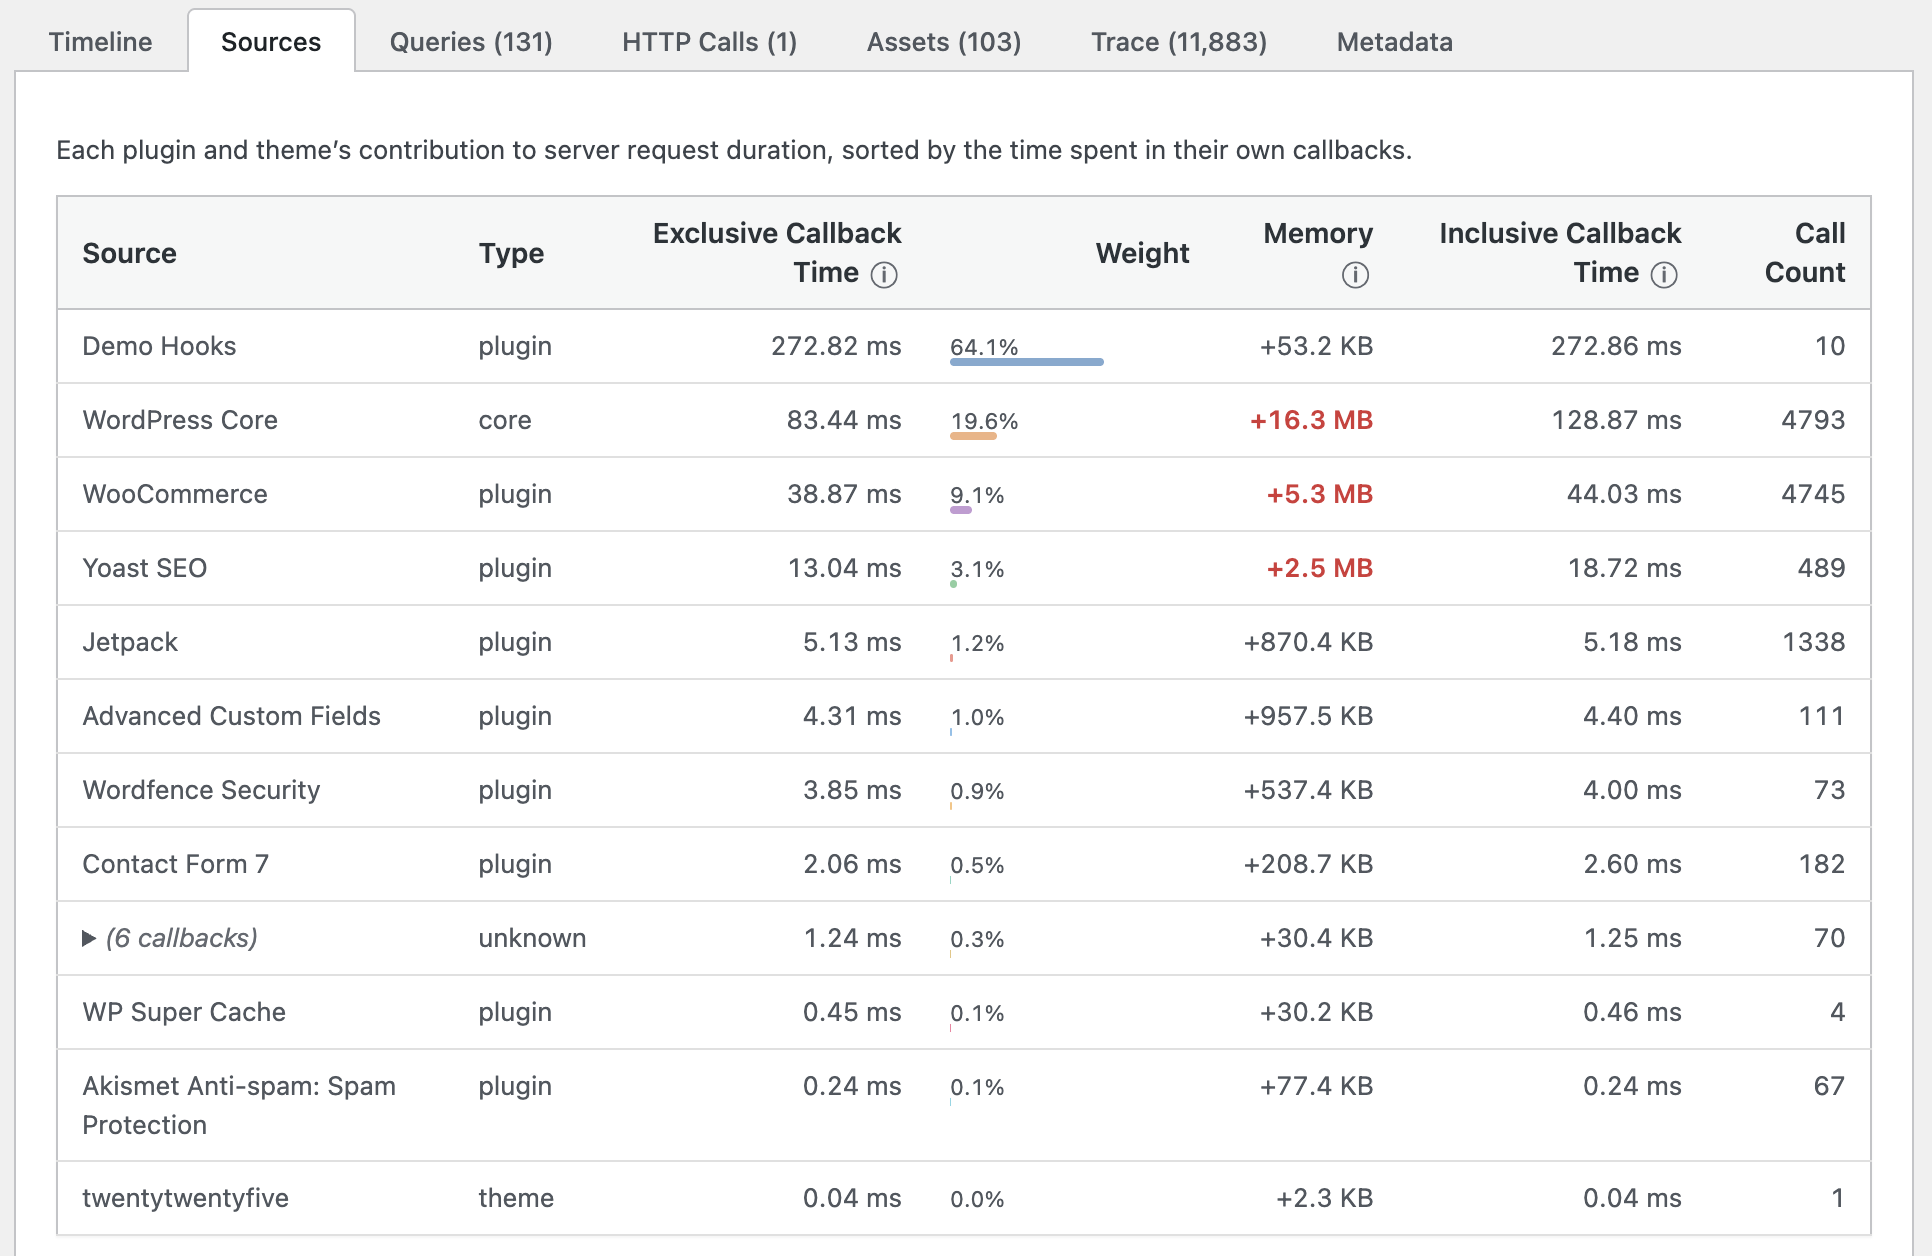
Sources tab ranking each plugin and theme by exclusive callback time
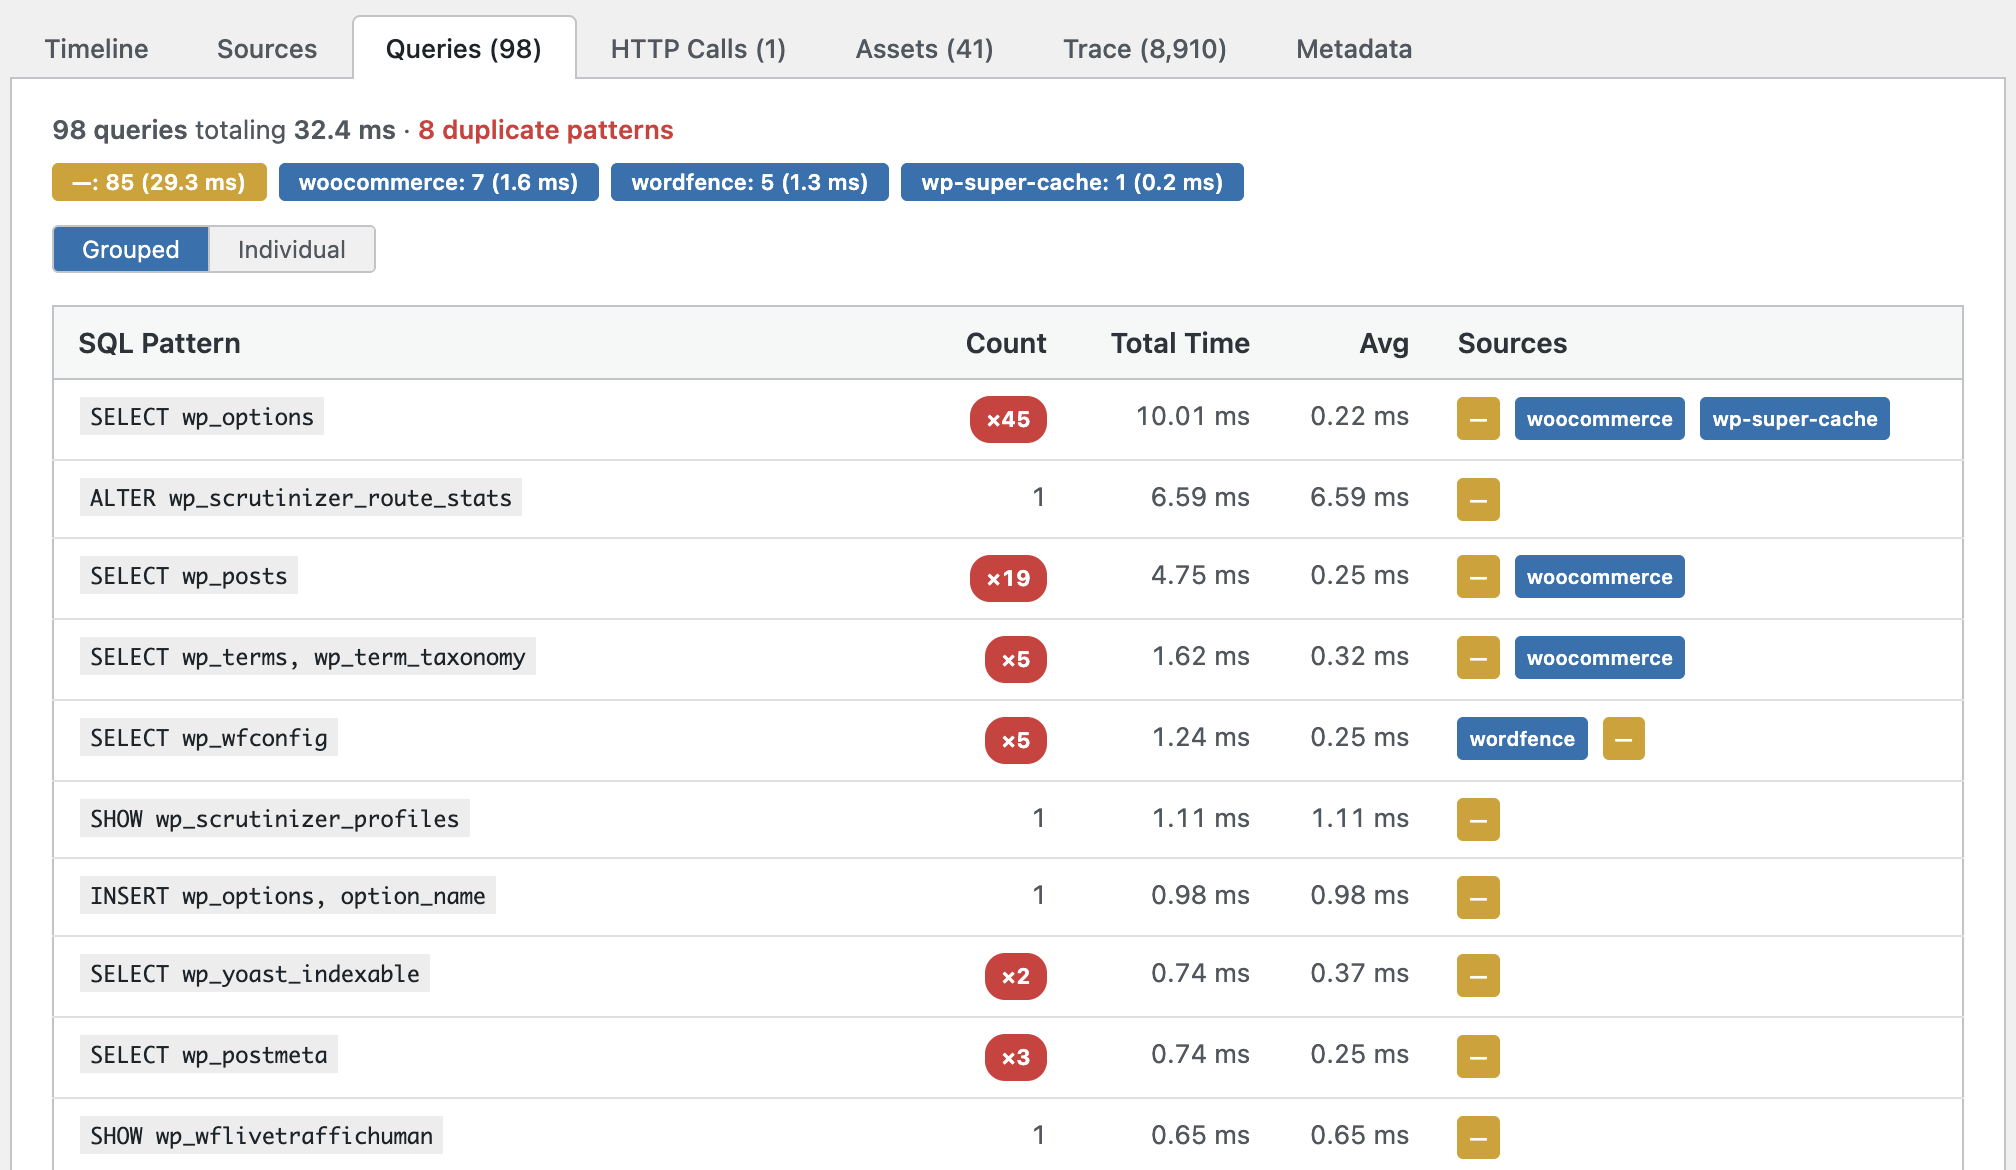
Queries tab with grouped SQL patterns, duplicate detection, and source attribution

HTTP Calls tab listing external requests with status, duration, and caller
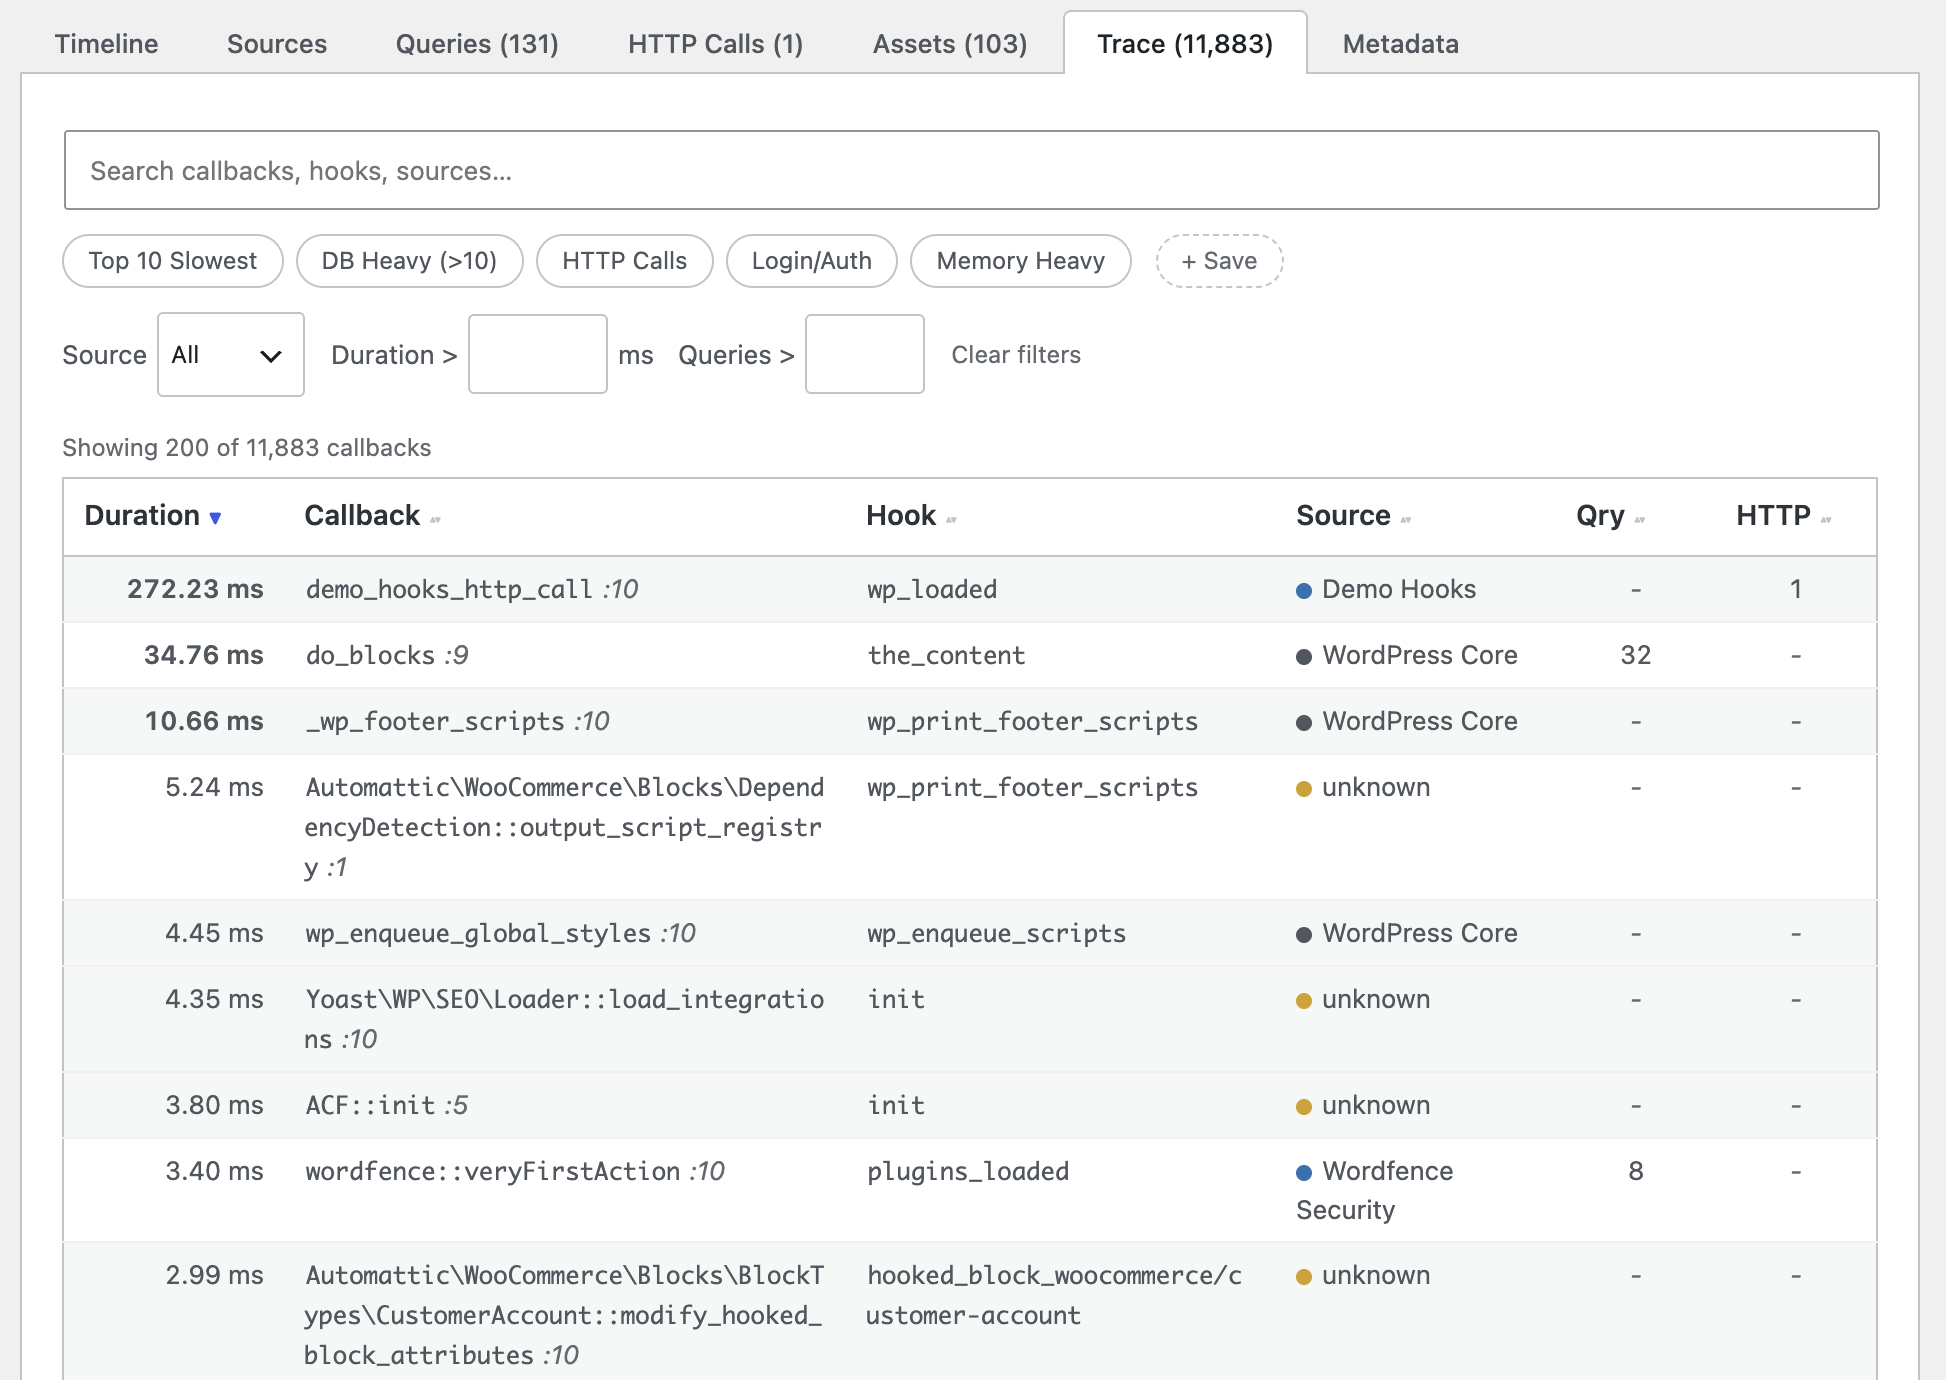
Trace tab with 11,883 callbacks, search, filter presets, and sortable columns
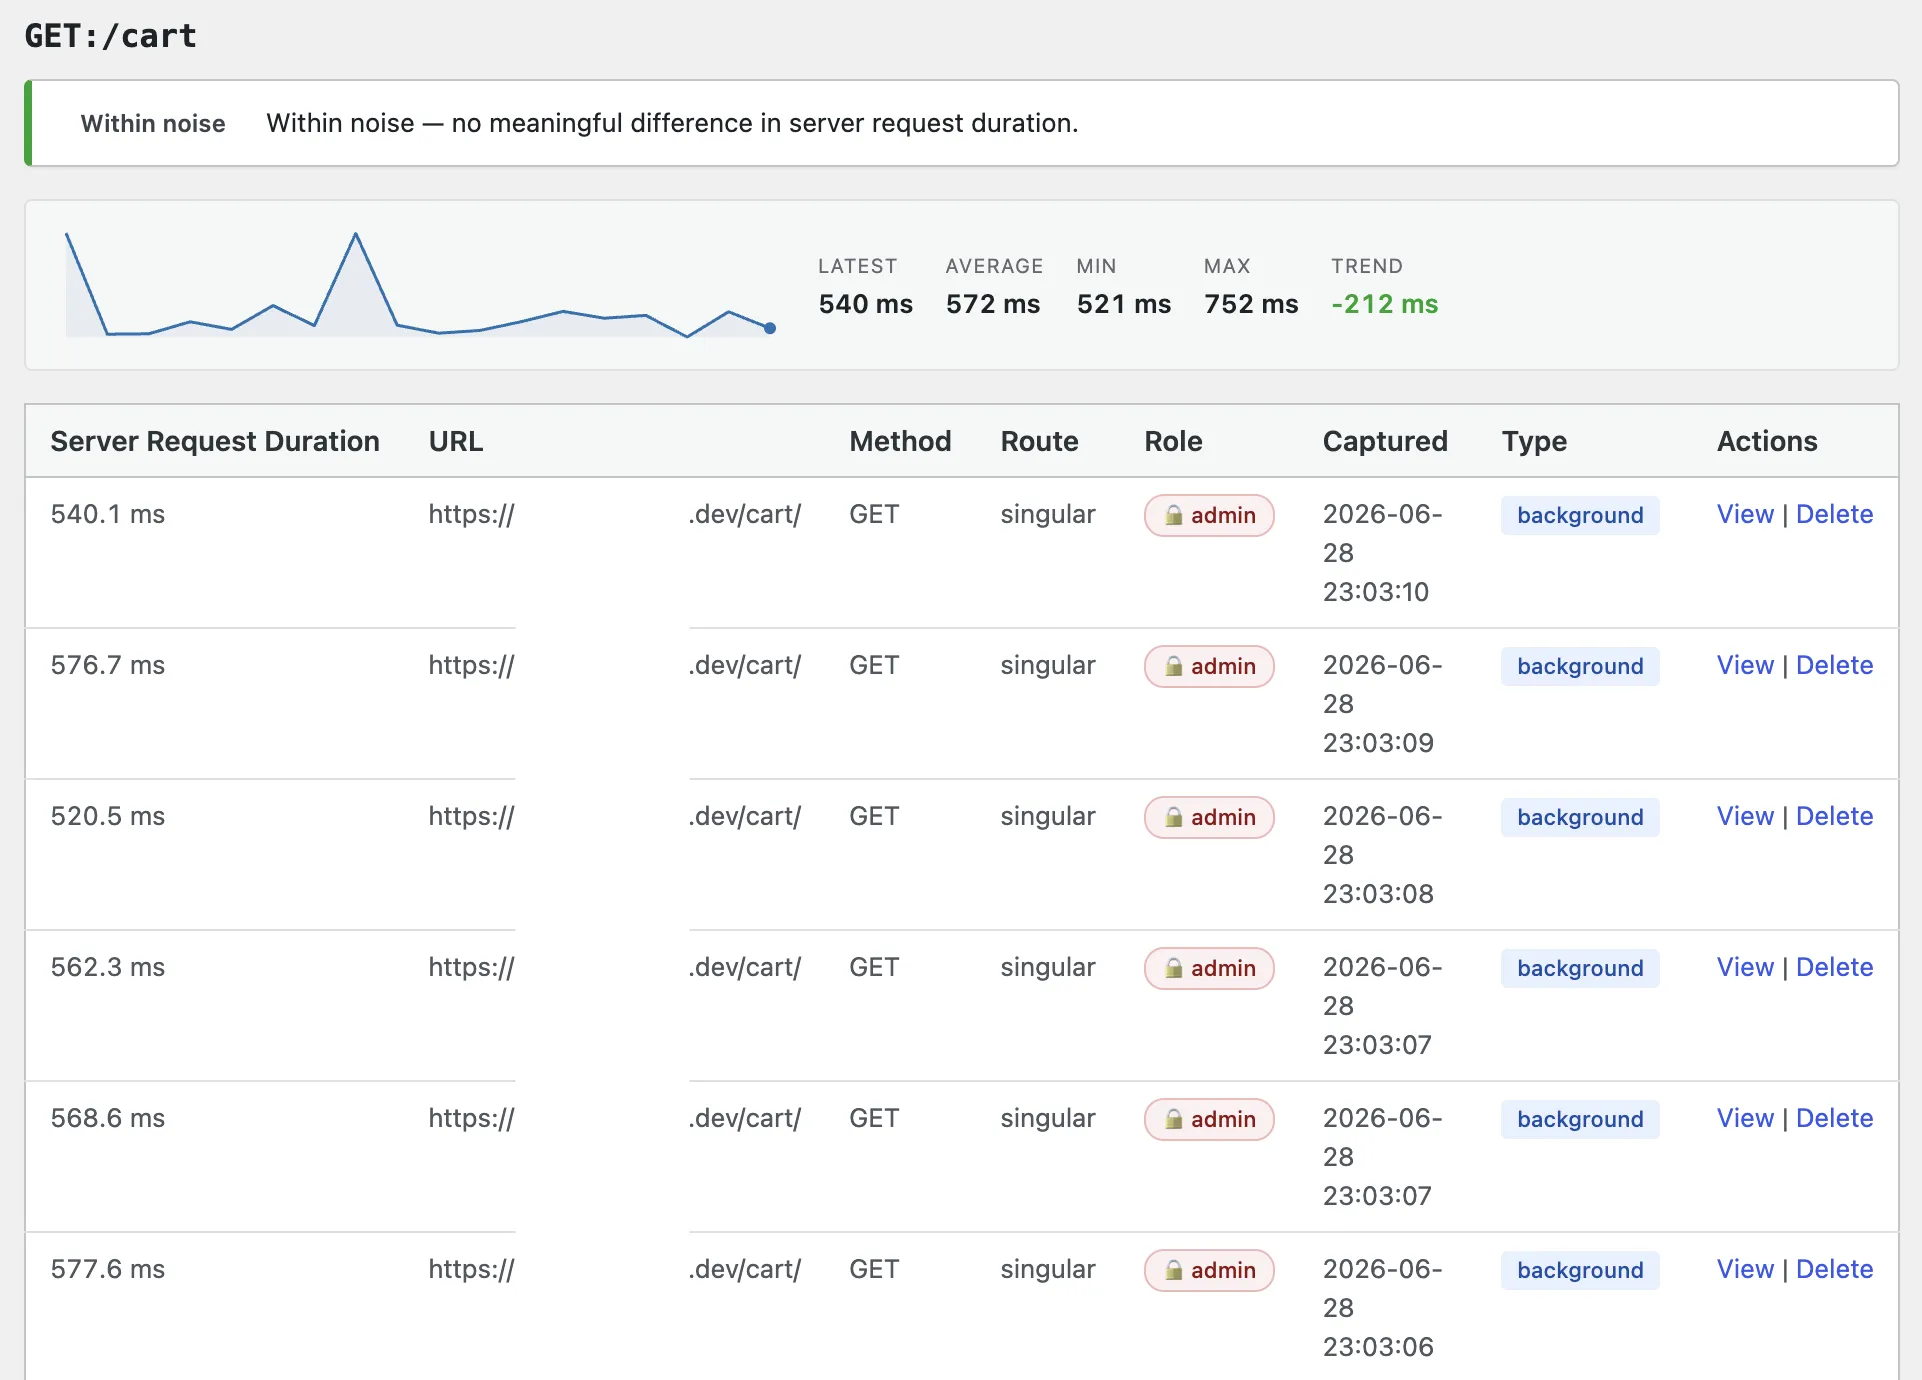
Routes view with trend sparkline, regression detection, and profile history
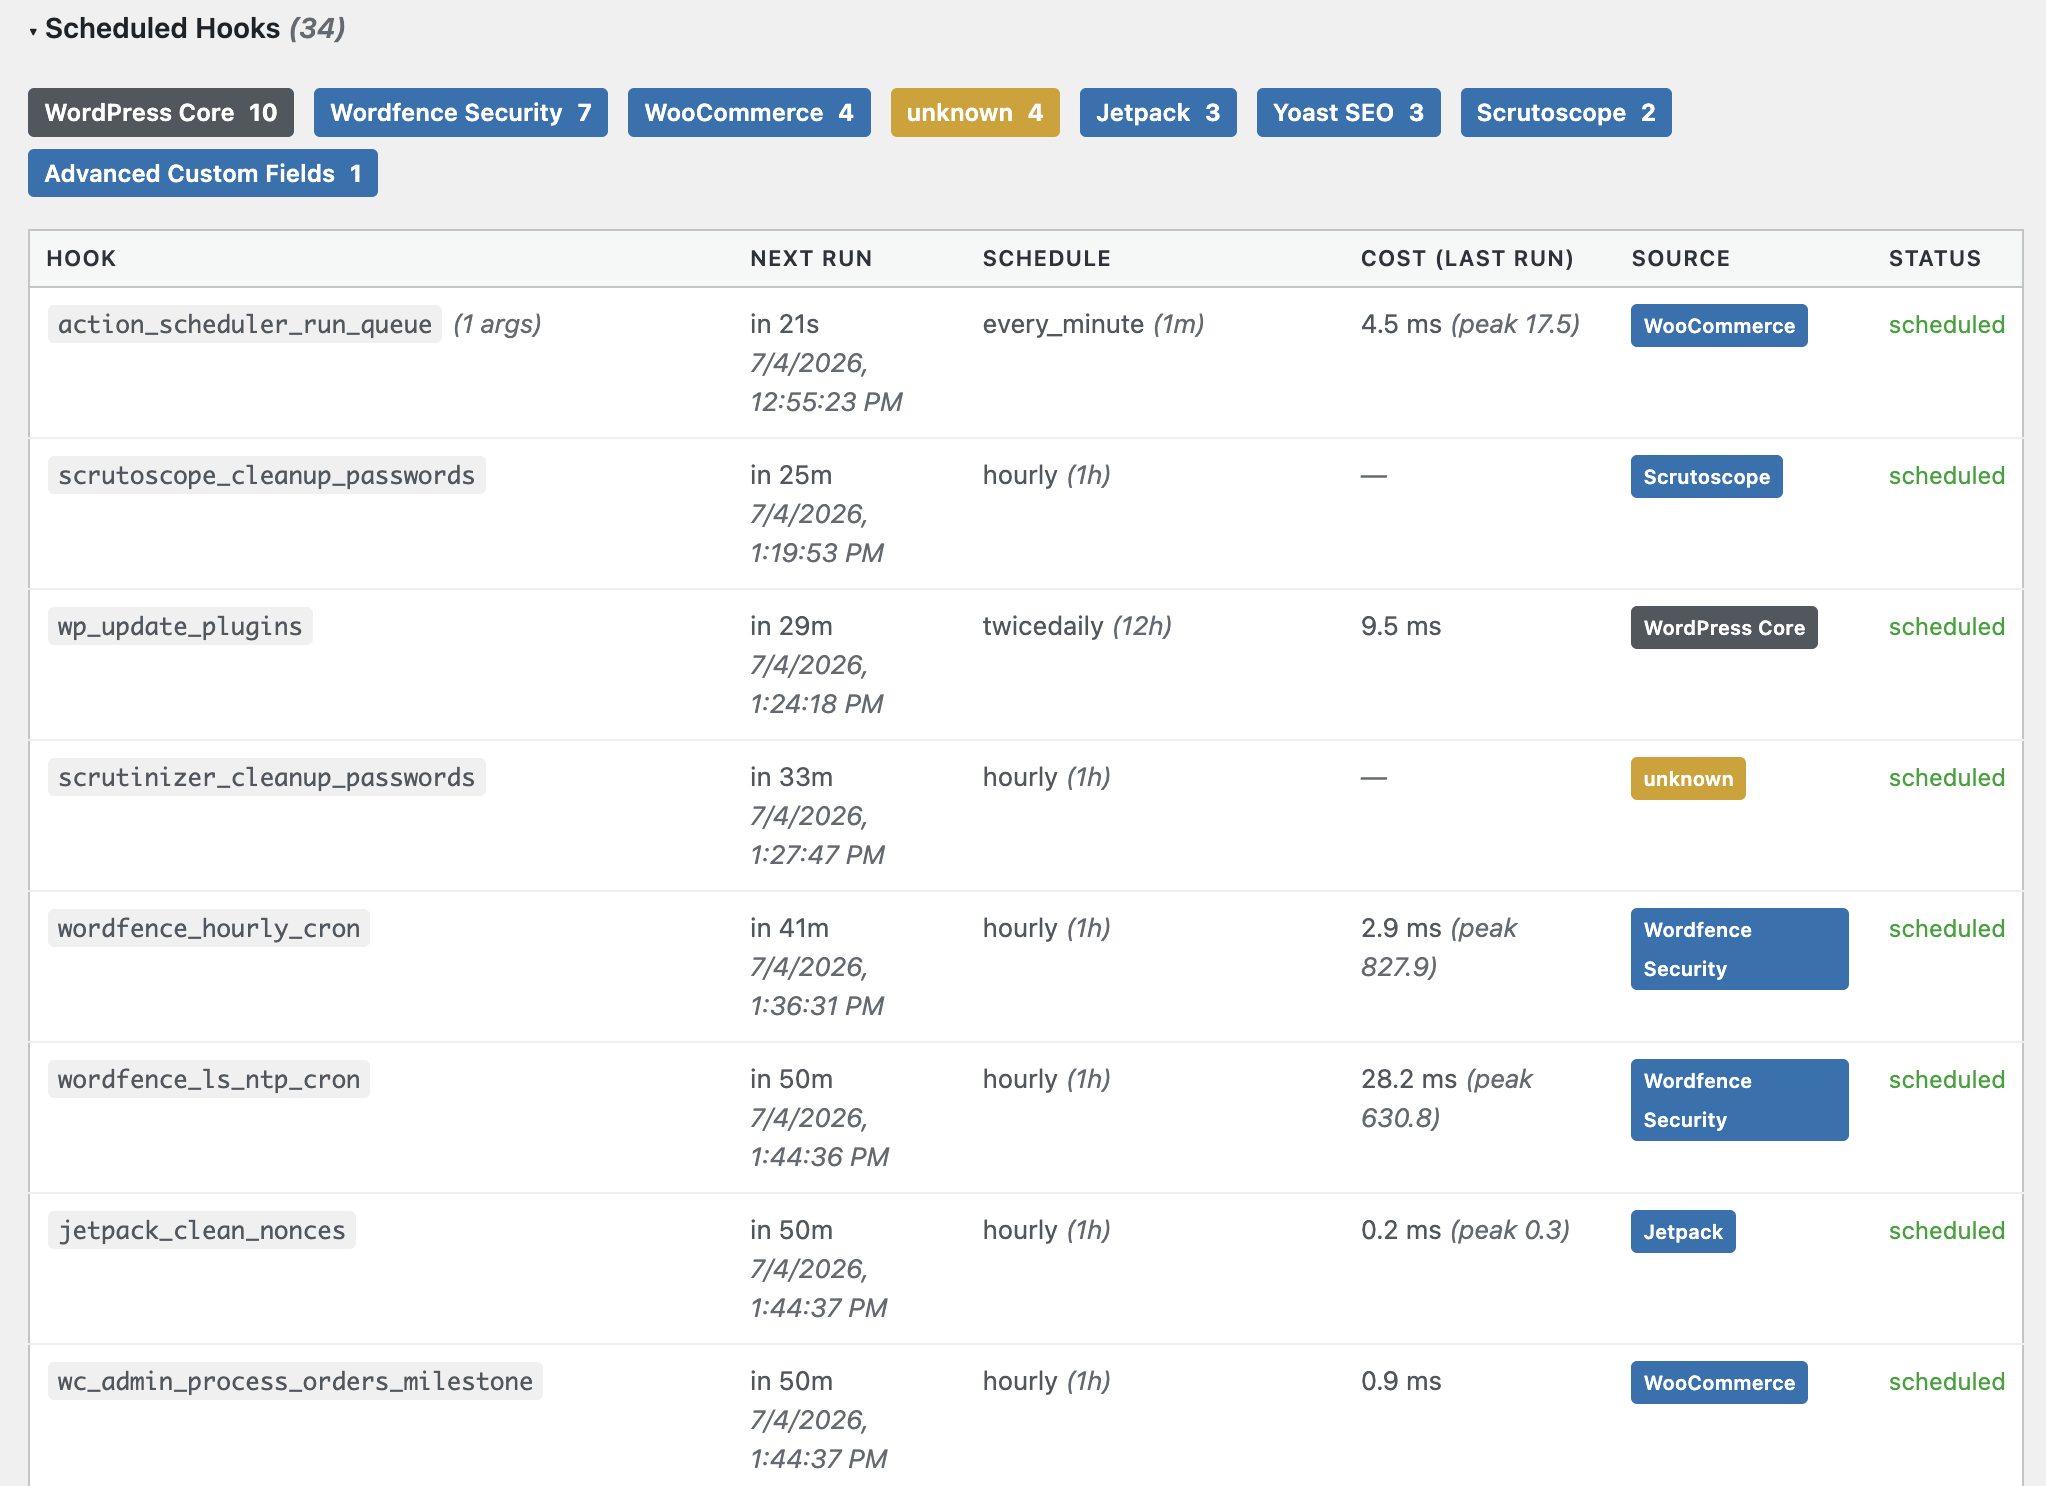
Cron tab with scheduled hooks, source pills, cost from last run, and overdue alerts
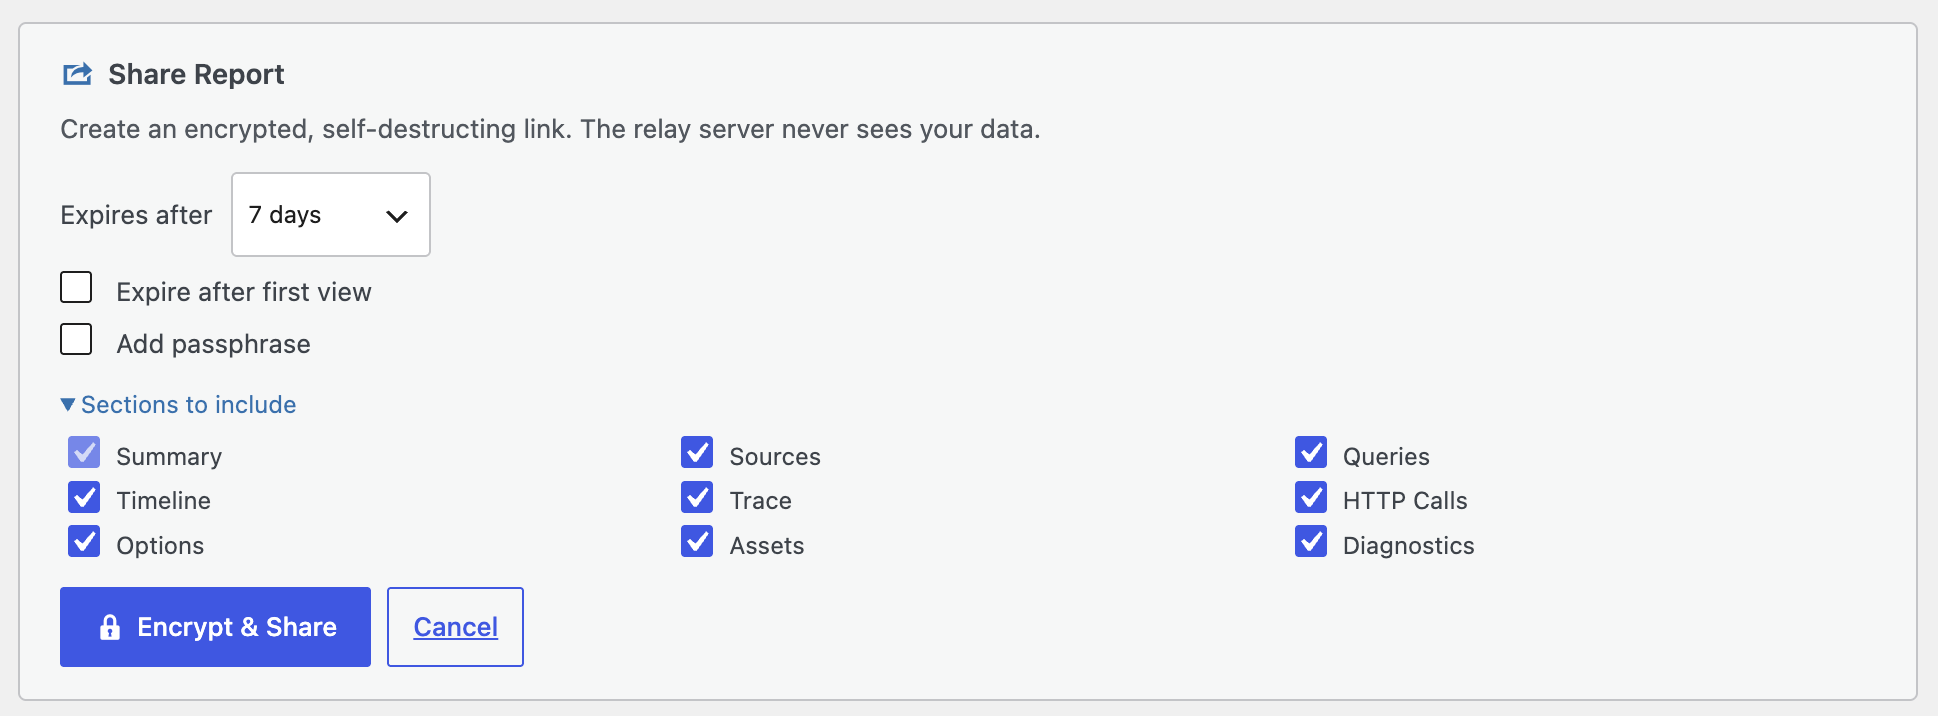
Share Report dialog with expiry, burn-after-read, passphrase, and section checkboxes
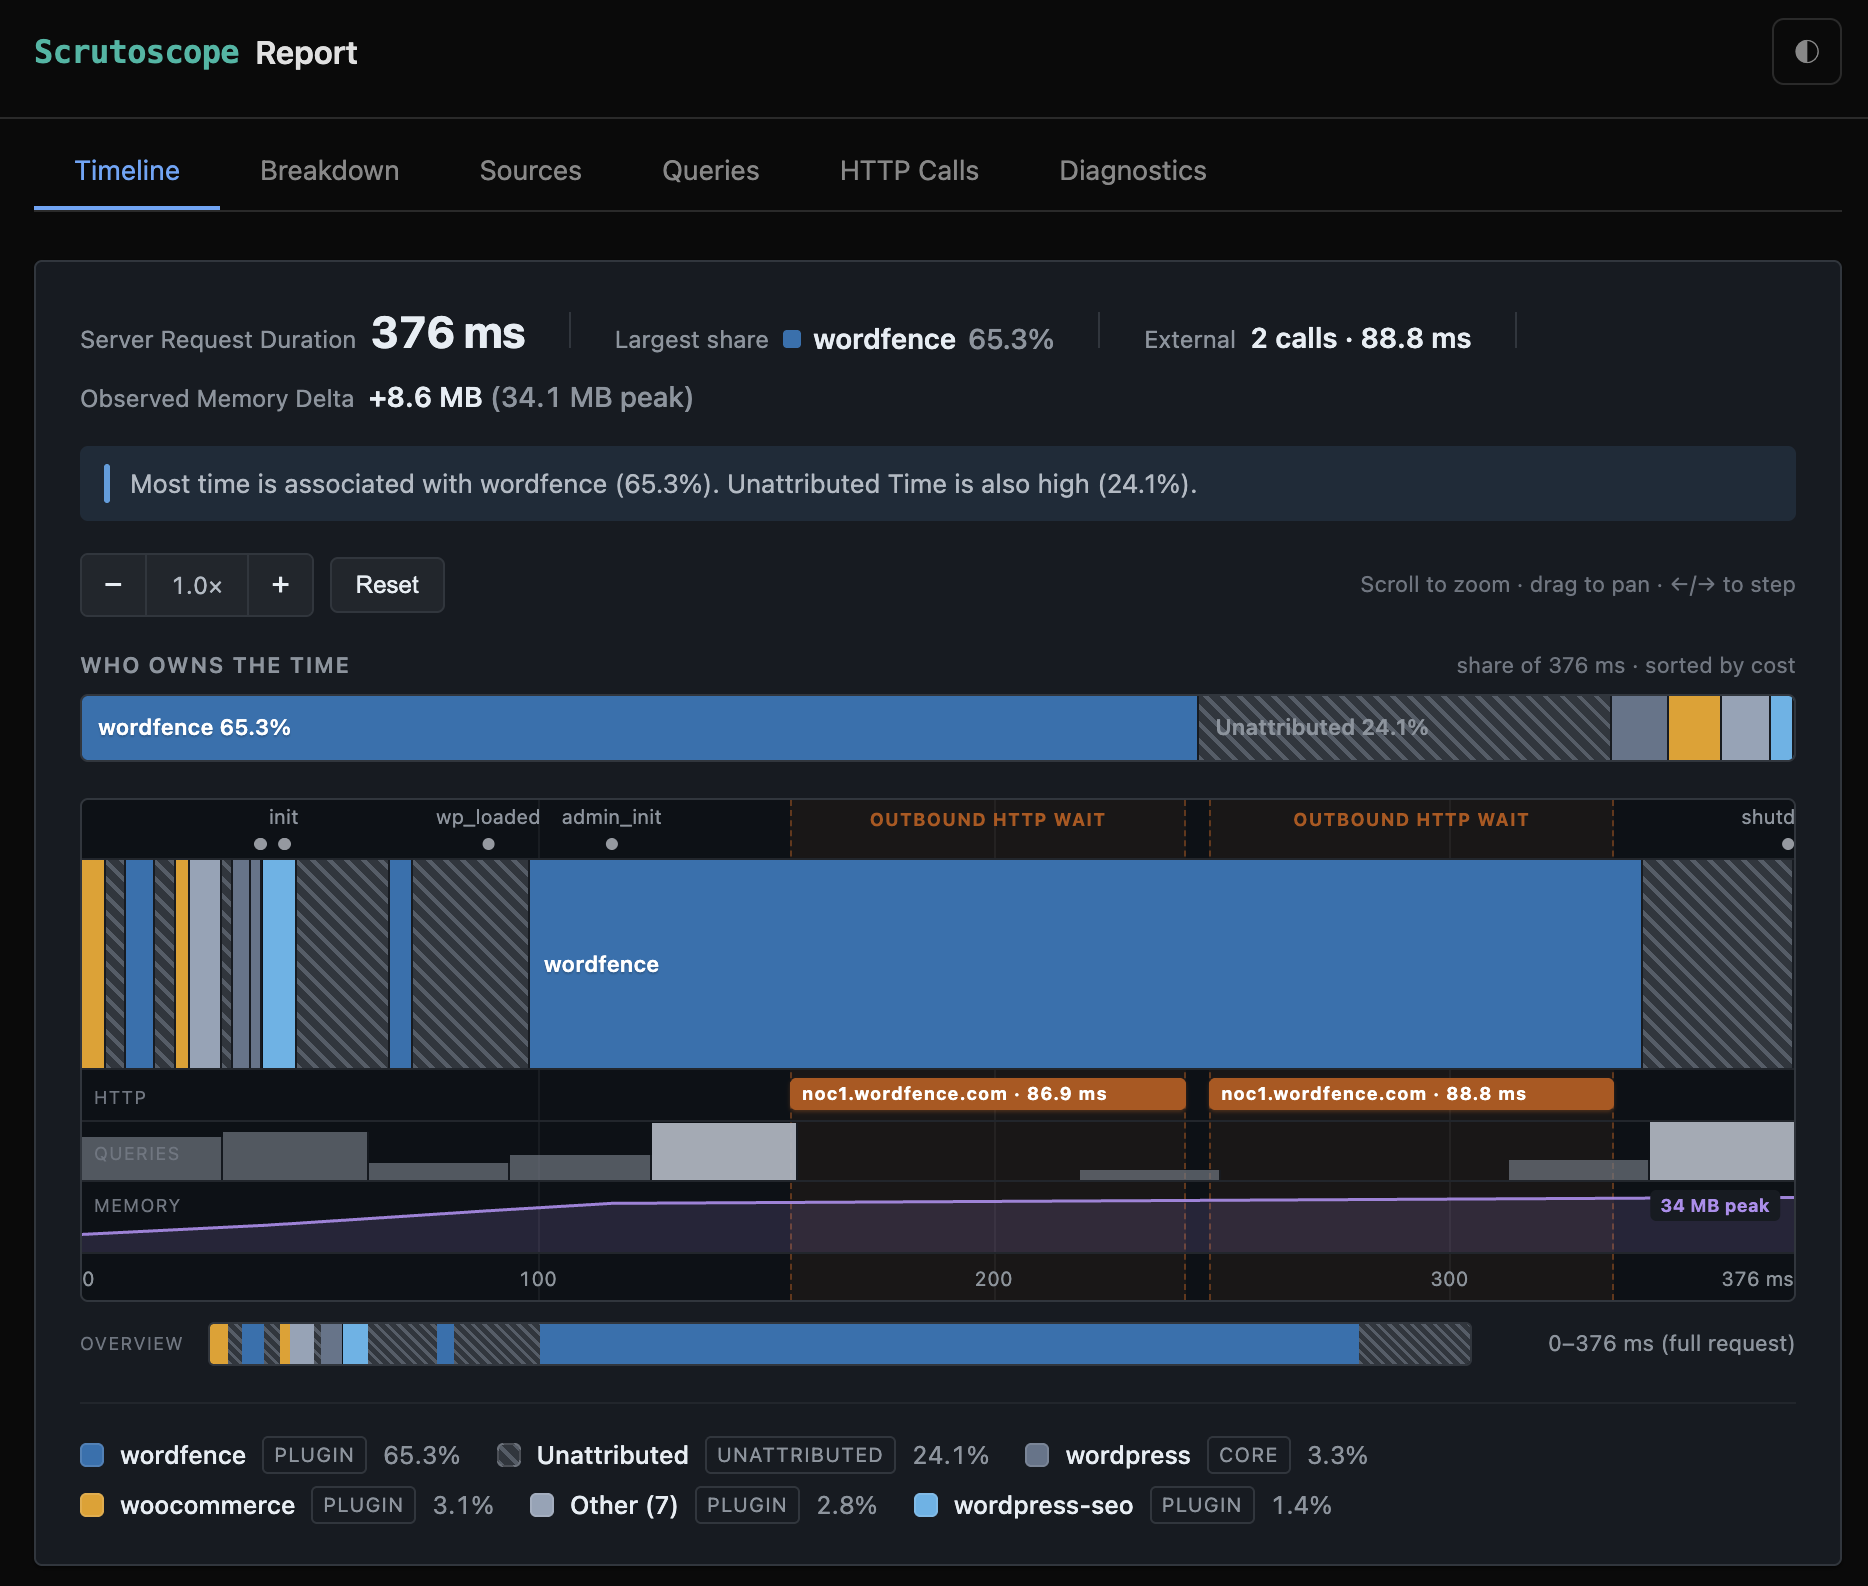
Shared report opened in the zero-knowledge relay viewer (decrypted in the browser)
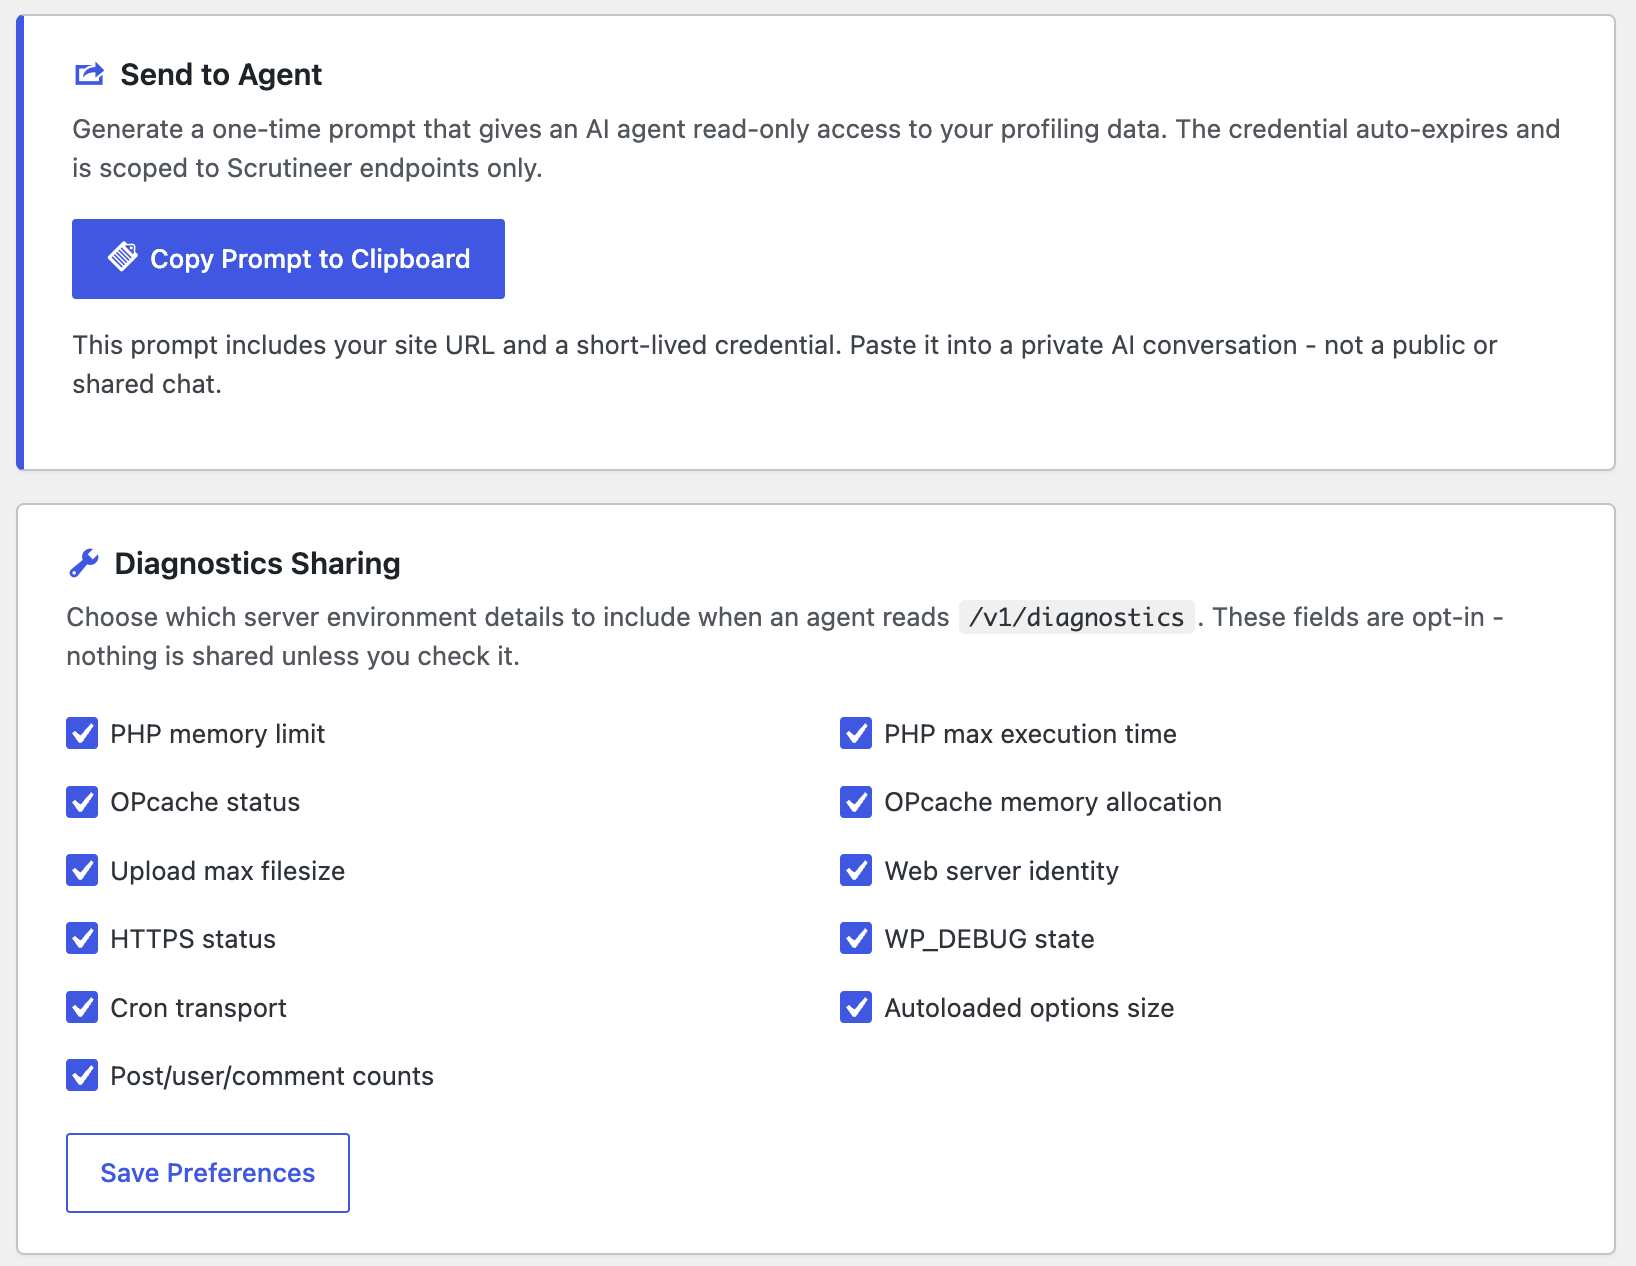
API tab: Send to Agent with one-click prompt generation for AI coding agents
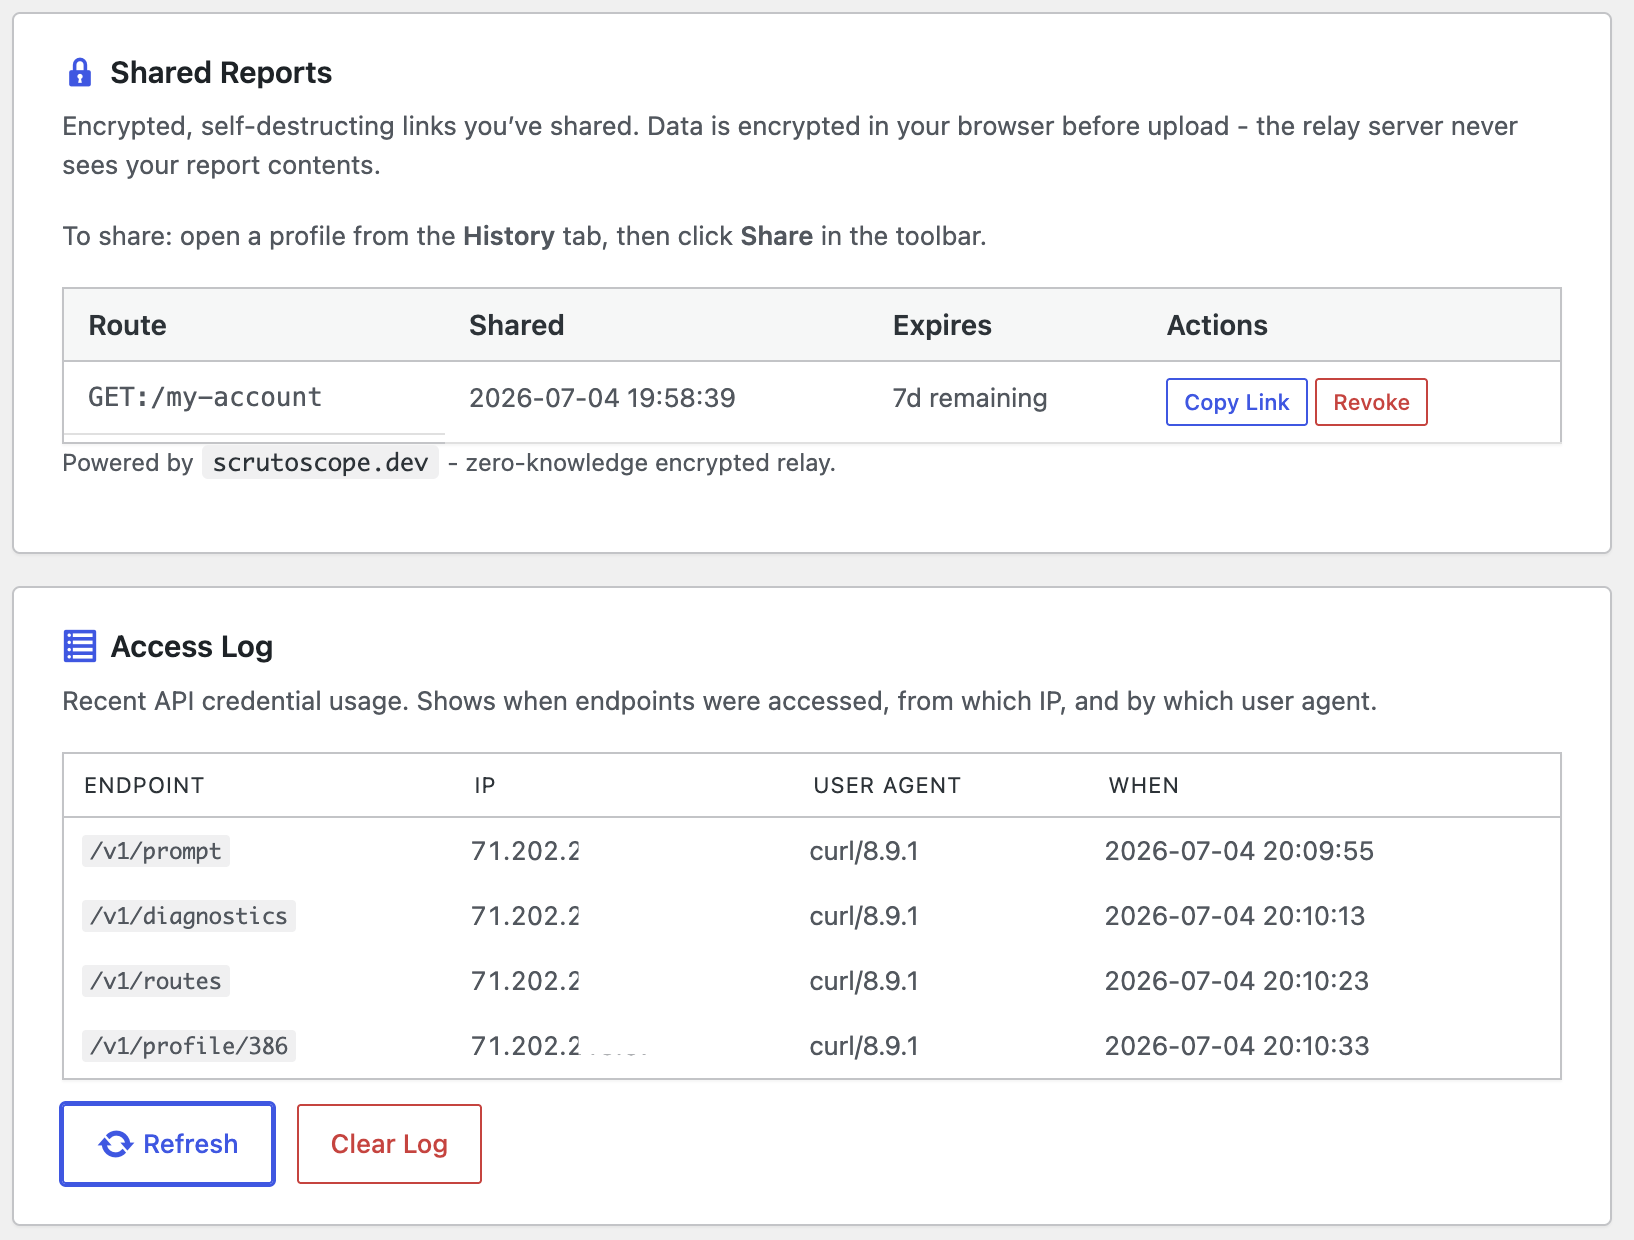
API tab: Shared Reports ledger and Access Log showing endpoint usage by IP
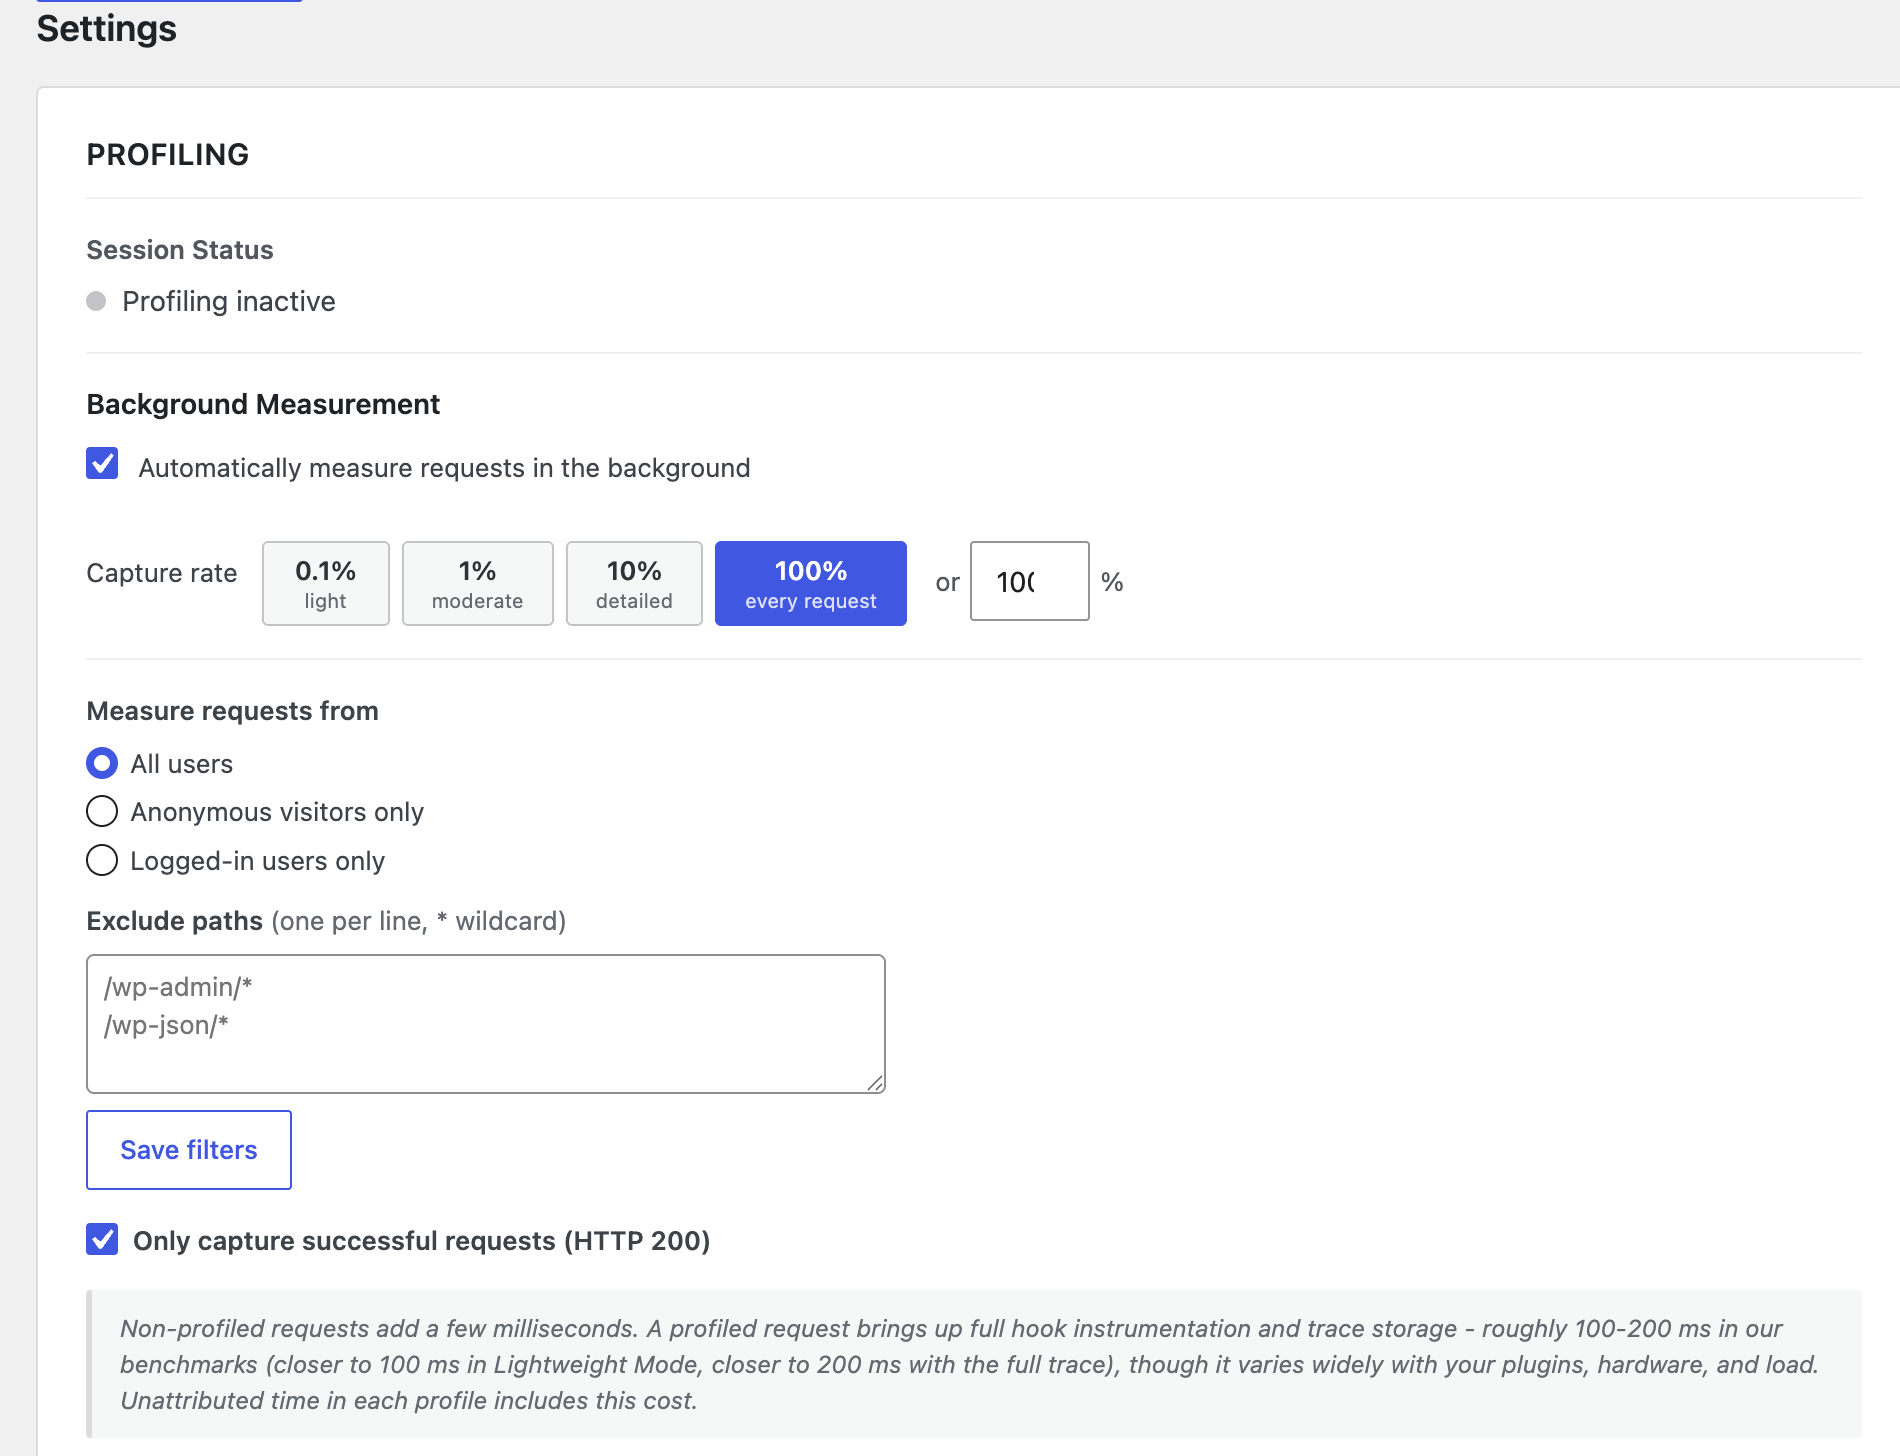
Settings: background measurement, capture rate presets, user/path filters
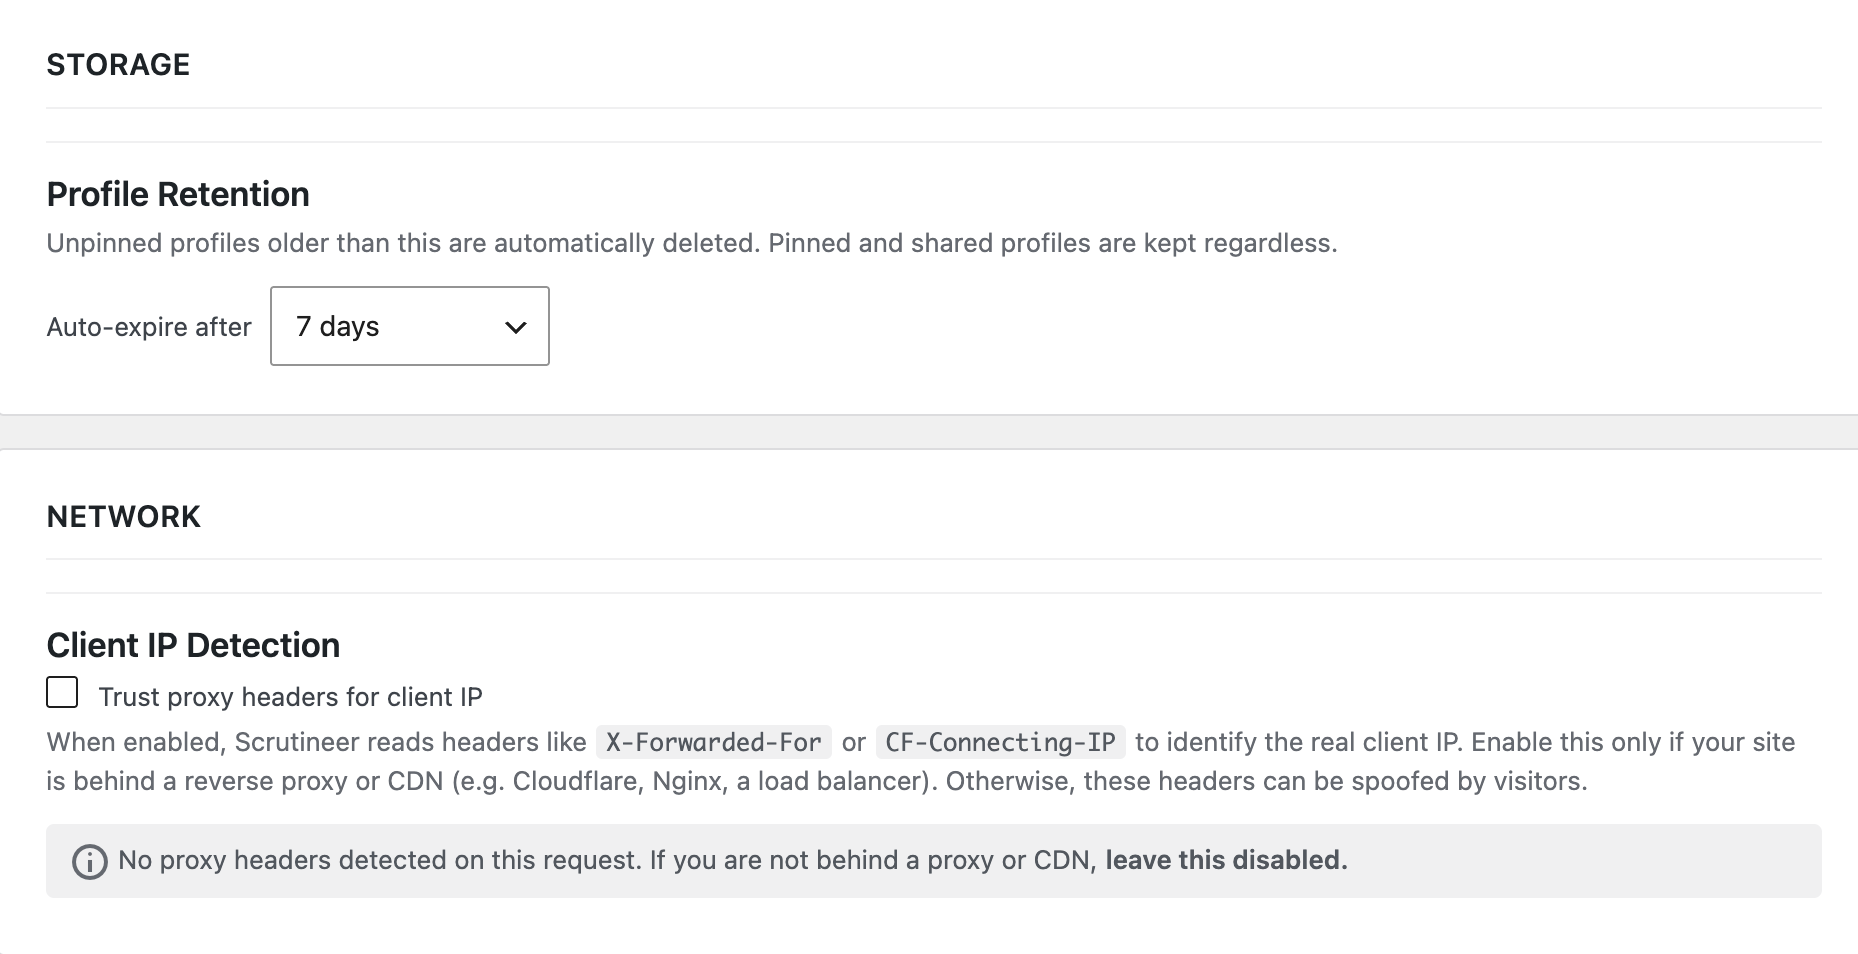
Settings: profile retention and proxy header trust for CDN/load-balancer setups
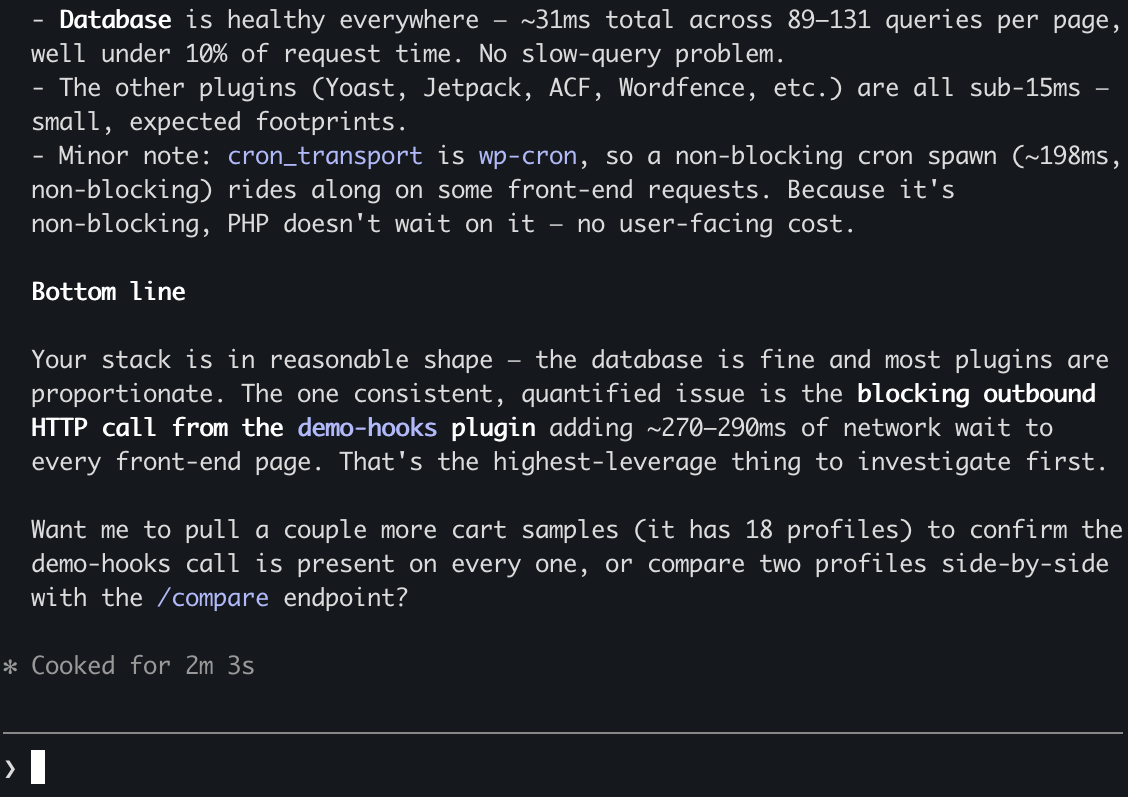
AI agent terminal output diagnosing a blocking HTTP call as the top performance issue